

What is going on with California workers' pay?
And other insights from the latest QCEW release

Right around Thanksgiving, an article in the local papers by Jonathan Lansner asked, “why did average wages fall in California between Q2 of 2021 and 2022”? At a time when workers were already hurt by rising inflation, a decline in nominal wages is even more disturbing. Lansner found a statewide decline of weekly wages by 0.6% over that period.
Since the data were not fully released at the time of publication (just the headline -0.6% rate), Lansner speculated in his article that it had to do with the rapid growth of the Leisure and Hospitality industry during this time. Average weekly wages in that industry in the state are $709 as of Q2 2022, significantly below the all-industry average of $1,572. Essentially, high employment growth in a low-wage sector like that can drive down average wages for all.
Now (as of last Tuesday) that we have the full Q2 2022 data release, we can answer this question more concretely. The Quarterly Census of Employment and Wages (QCEW) is one of the most anticipated data releases because it provides a comprehensive look at employment and wages by county and by major industry.
It turns out that, yes, annual Leisure and Hospitality employment did increase by a major amount in California between Q2 of 2021 and 2022 (16.1%). Also, another low-paying sector, “Other Services” (which includes a variety of personal care services which were also hit hard by the pandemic), pays $958 an hour and had job growth of 10.8% over the same period. But a few other things happened to push down average wages as well. Average weekly wages declined in the Information and Financial Activities sectors (-12.1% and -11.2% respectively), both of which are traditionally high-wage sectors (workers in these sectors earned about $4,031 and $2,271 per week respectively). Both sectors had decent job growth over the year (12.6% and 2.2% respectively), but the fall in wages in these industries statewide brought down average wage growth as well. Thus, the story is partly about sectoral composition of employment (rising, or recovery, of employment in Leisure and Hospitality and “Other Services” sectors), but it’s not the whole story.
Luckily, the Inland Empire did not follow California’s trend. In San Bernardino County, all-industry Quarter 2, 2022 average weekly wages increased by 3.5% over the year, backed by strong employment growth in Leisure and Hospitality and Other services, but also Manufacturing, Professional and Business Services, and of course Trade, Transportation, and Utilities. Indeed, San Bernardino workers saw wage gains across the board, with the largest increases in Professional and Business Services (6.0%) and Health and Education Services (5.1%). A very similar story can be told for Riverside County.
Since I’m on the topic of the QCEW data release, one trend I’ve been tracking with it is the region’s logistics sector employment location quotient (see here for one example of such a post, from this time last year). Essentially, I track how “concentrated” logistics jobs are becoming in the local economy compared to the concentration of logistics jobs across the entire U.S. For example, suppose 15% of Region A’s employment is in Logistics, but 10% of total U.S. employment is in Logistics. Then Region A’s Logistics location quotient is 1.5, meaning that jobs in Logistics are 50% more common in Region A than they are in the entire U.S. See the chart below, which tracks this information before and after the pandemic for San Bernardino County.
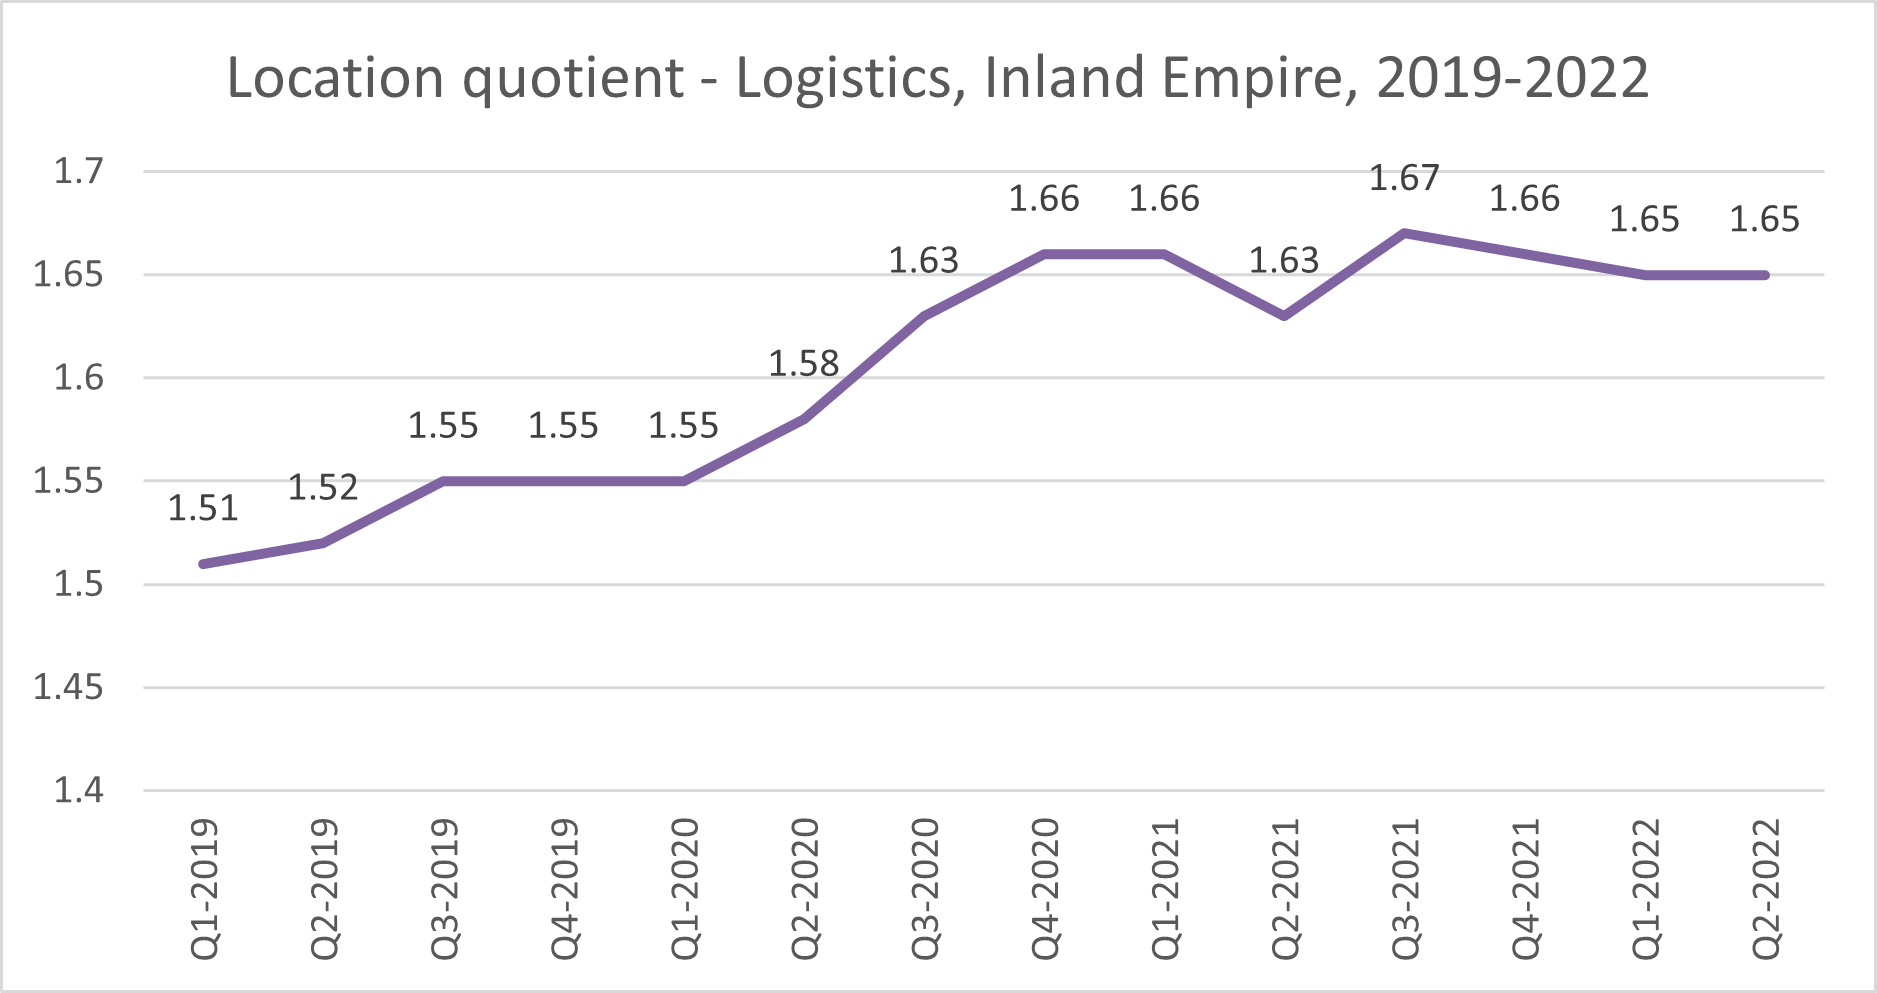
When I first started tracking this statistic, I already knew that logistics had increased its regional importance during the pandemic. Indeed, it’s likely what allowed our labor market to recover more quickly than other metro areas in Southern California. But what appears to have initially been a response to pandemic conditions, has now seemingly turned into a “new normal” – jobs in Logistics are 60% more likely here than elsewhere and have remained so even through the recovery. This trend mirrors the rising composition of logistics jobs in the Inland Empire.