Three things to take away from the gold standard of economics data sources
Some surprises in the Q1 2021 QCEW release
Note: Thank you for sharing! Make a note to forward this article to one person who you think might benefit from this news. Whether it’s a friend, colleague, or even family, let them know that the IE Economic Update is the place to go for local economic news. See you next week for an inflation update!
The Quarterly Census of Employment and Wages (QCEW) is a true census, taken 4 times a year and released about 6 months after a quarter has ended. They are the most accurate labor market data we have.
With the Q1-2021 data released last month, I wanted to share three things we are learning about the local economy during the depths of the pandemic-induced recession. Especially now with Q1-2021 data, we can track how the economy evolved through the worst months of it all.
Lesson #1: Logistics employment grew and outpaced the rest of the country
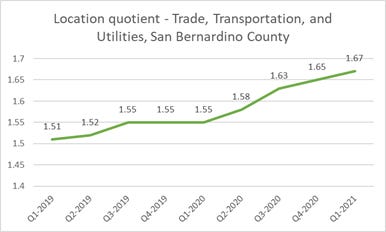
We all know that logistics employs a large share of workers out here, and employment in this industry grew during the Q1-2020 to Q1-2021 period. What you might not know is that the growth of logistics even out-paced the national growth of logistics employment during this period. This is shown in the location quotient for Trade, Transportation, and Utilities, which measures employment shares in that industry in San Bernardino, relative to employment shares in that industry nationally. A higher number means that our employment share in this sector outpaced the national employment share, and as you can see from the chart, this really picked up in Q2-2020.
Lesson #2: Wages rose through Q4-2020, but dropped in Q1-2021
Average wages rose from $966/week in Q1-2020 to $1,112/week in Q4-2020 – a remarkable 15% increase in the middle of a recession. However, in Q1-2021, they dropped back down to $1,002/week. That’s still a 3.7% year-over-year increase, but nothing as dramatic as we were previously thinking. This wage growth was also spread more evenly, rather than being concentrated in logistics as previously thought.
Lesson #3: Leisure and hospitality benefitted greatly from the vaccine roll-out
One feature of the QCEW is the reporting of monthly employment totals. In the Q1-2021 release for example, we can evaluate employment changes from January 2021-March 2021, which is right in the middle of the vaccine rollout. Over this period, “leisure and hospitality” and “other services” employment grew by 10% and 13.6% respectively. This gives you a sense of how significant the vaccine is to these industries, and it also helps explain, now that regional vaccination rates have stalled, why these industries are not back to “full capacity”, so to speak.
While there is quite a delay in the QCEW data releases, the quality of information they provide is of great benefit to understanding how local conditions respond to various events.


