

Tracking the meteoric rise in logistics
The Inland Empire is known as a hub for logistics, but the timing of its phenomenal growth might surprise some

Over the last 30 years, one of the biggest stories of the Inland Empire’s labor market has been the rise in the “Trade, Transportation, and Utilities” set of industries. In 1990, these industries employed 20% of the region’s labor force. Today, they employ about 27%. Further, as you probably know, logistics companies drive many dynamics, from wages to unemployment rates, to politics and city budgets.
Trade (such as retail trade), transportation (of traded goods), and logistics (the coordination of moving these goods where they need to be, to both consumers and firms), have all been a large component of the change. But the rise of logistics in particular has been meteoric. Most of you probably know the story, but the statistics will give you a better grasp of their magnitude and their timing.
Between 1990 and 2020, the overall regional nonfarm labor force grew from 720,400 to 1.5 million workers - about double over 30 years. Employment in “Trade, Transportation, and Utilities”, coded as supersector 40 by the BLS, grew from 149,700 workers in 1990 to 403,800 in 2020 - a four-fold increase over the same time period. This explain the “20% to 27%” statistic mentioned earlier.
Upon further inspection, it turns out that most of the growth in “Trade, Transportation, and Utilities” has come from just a few sources. Let’s break this larger sector down into 3 smaller ones: “Wholesale trade”, “Retail trade”, and “Transportation, Warehouses, and Utilities”, classified by the BLS as supersectors 41, 42, and 43.
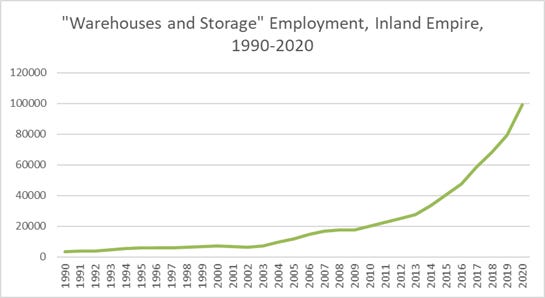
I find that the growth in supsersector 43 is concentrated in BLS industry codes “400089”, and “493000”, which refer specifically to “Transportation and Warehousing” and “Warehouses and Storage”. The latter industry catapulted from a mere 3,200 workers (0.4% of regional nonfarm employment) in 1990 to 99,200 workers (6.6% of regional nonfarm employment) in 2020 - that’s a 3,000% growth rate!
The graph above gives you a better sense of the timing of these changes. While the numbers have undoubtedly trended upward since 1990, there is clearly a sharp acceleration in the trend since the recovery from the Great Recession, in 2010-2011. In other words, the major acceleration in this industry is just over the last 10 years or so.