

County-level Real GDP growth stats!
San Bernardino County saw the second-smallest decline in SoCal - here's why

Note: the IE CPI/inflation statistics were released this morning - 7.9% inflation, second-highest out of the 20-or-so metro areas the BLS tracks. Analysis will come in Tuesday’s regular economic update; feel free to contact me if you’d like to know more sooner than that.
On Wednesday (December 8), the Bureau of Economic Analysis released its estimates of county- and metro-level Real GDP for 2020. Real GDP is normally only available at the state or national level, so this release is a real treat for regional economists.
Real GDP growth measures the change in production of goods and services in an area. Real GDP does not factor in price changes, so these are actual changes in production or output. When Real GDP growth is positive, the economy is producing more goods and services than it did before – the economy is expanding. When Real GDP growth is negative, the economy is producing fewer goods and services than it did before – the economy is shrinking.
Released just once a year, these data (click here to see) offer a unique perspective on the processes of economic growth at a finer level of geographic detail than we are used to seeing. For example, Real GDP statistics can help economists identify which sectors contribute to an economy the most, in a way that employment data cannot fully capture, because employment data do not account for how much value sectors are creating for an economy.
Between 2019 and 2020, Real GDP growth in San Bernardino County fell by 1.9%. This might sound bad, but as you can guess, most counties’ economies contracted last year. For example, the state of California’s Real GDP dropped 2.8%. Locally, nearby Los Angeles County suffered a 6.9% drop in Real GDP, while San Diego’s dropped 2.9%. San Bernardino’s Real GDP decline was the second-smallest out of all of Southern California; only Kern County’s economy (1.1% decline) shrank by a smaller amount. Refer to the map below.
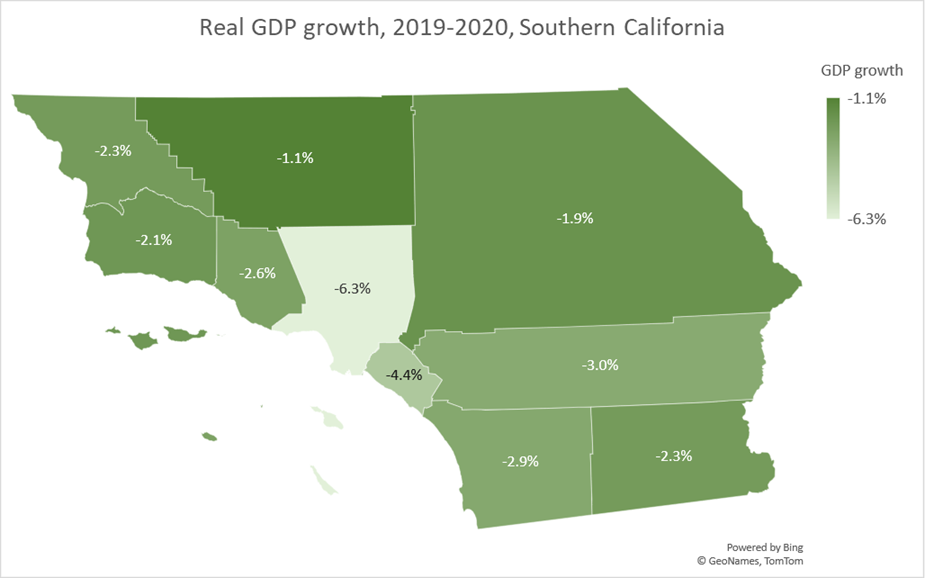
San Bernardino and Kern County did relatively OK for different reasons. Kern benefited from its agricultural sector, which increased 20% in the County between 2019 and 2020. Agriculture composes about 13% of Kern’s GDP (only 2.1% of California’s GDP). In San Bernardino, transportation and warehousing output increased by 9.9%; this sector accounts for about 8.5% of our total output and helps explain why we did relatively well.
The BEA’s statistics offer industry-level analysis of Real GDP growth both at the county-level and at the metro level (for the Inland Empire). If you’re interested in learning more, you can contact me via email or by commenting on this post.
It’s very interesting that agriculture accounts for only 2.1 percent of California’s GDP. I always imagined it to account for a larger share. Regarding the substantial jump in Kern County’s agricultural output: I wonder what types of crops the county produces, and why demand for them was (presumably) quite strong. (Forgive me if I am not interpreting the findings correctly!)
It’s very interesting to see that agriculture accounts for only 2.1% of California’s GDP. I always imagined (without actually looking at data) that agriculture accounted for a larger share. Regarding the big jump in agricultural output in Kern County: Do you have a sense of the types of crops produced there?