
Who earns the minimum wage in California?
Who earns the minimum wage in California?
Some characteristics of minimum wage workers might surprise you

Note: this week’s Friday special topics post is on a new policy initiative which I plan to explore in depth over the coming months. If you’d like to see more discussion of federal, state, or local policies and how they might affect the Inland Empire, leave a comment or get in touch via email.
Back in March 2016, California lawmakers voted to raise the minimum wage to $15/hour by 2022 for large businesses with 26 or more employees, and to do the same by 2023 for small businesses with fewer than 26 employees. The increases are in the amount of $1 per year (so $10 to $11, then $11 to $12, and so on), and started on January 1, 2017. As of January 1st of this year and with only a handful of extremely small exceptions, large businesses must pay all workers a minimum of $15 per hour.
Even though the new ordinance has not yet taken full effect (minimum wage workers in businesses with fewer than 26 employees just started making $14/hour on January 1st), there is already a new initiative to push California’s minimum wage up to $18 by 2025 for large businesses and by 2026 for small ones. Joe Sanberg, known for the excellent CalEITC4Me, is at the head of the initiative, which can be read here (media commentary here). The proposal would simply extend the $1 yearly increases of the existing legislation through 2025/2026 instead of stopping them in 2023. So in 2023, large businesses would be forced to pay their workers $16/hour; in 2024 $17/hour; in 2025 $18/hour.
Notably, after 2026 (after 2023 in the original legislation), annual inflation-based adjustments to the minimum wage – also known as minimum wage indexing – would kick in.
It’s not clear whether this new initiative could pass, but the cost of living is one of the biggest issues identified by California voters. In a November 2021 statewide poll of likely voters by the Public Policy Institute of California, 81% of Californians identified the lack of well-paying jobs as at least somewhat of a problem in the state – a view shared across the political spectrum. Furthermore, according to that same survey the lack of good pay is forcing about 25% of Californians to consider moving out of the state (although some of this is politically driven – about 45% of Republicans consider doing this, while only 15% of Democrats do).
Regardless of its chances among lawmakers, raising the minimum wage is a major policy initiative that will affect millions of California workers. There is a lot to discuss about how it might affect the economy, including but not limited to:
What kinds of workers would see a pay increase?
How many workers would see a pay increase?
How would the increase affect the labor (through employment impacts) and product markets (through price impacts)?
Today I’ll talk about the first of these questions, with later articles addressing the others.
In 2021, according to my analysis of data from the Current Population Survey, around 9,763,000 workers aged 16 or older, or about 56% of California’s workforce, were paid hourly. Of those workers, 11%, or about 1 million workers, made the minimum wage of between $13 and $14 per hour, not including tips (the CPS does not distinguish whether workers are in small or large businesses, so there is no way to be more precise than to consider this range of $13-$14 as a benchmark for the amount of minimum wage workers). Thus, in 2021, 5.7% of California’s total workforce of 17 million people were paid around the minimum wage.
These minimum wage workers have a median age of 30, which is 12 years younger than the median age of the overall labor force, and 54% of minimum wage workers are female. About 30% of minimum wage workers are married. About 33% of minimum wage workers have children (7% have children under the age of 5) and 34% are the heads of household. Finally, only 12% of minimum wage workers in the CPS usually receive overtime, tips, or commissions. These statistics all refer specifically to minimum wage workers in California.
Statistics on race/ethnicity, compared to the overall California workforce, are shown in the table below.
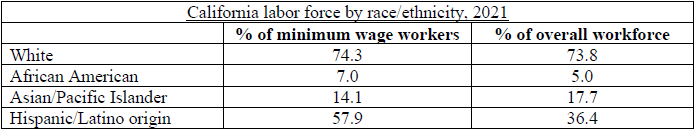
In terms of industry, 22.5% of minimum wage workers are in “restaurants and other food services”, and the rest are scattered across a range of others. The second- and third-highest industries employing minimum wage workers are supermarkets/grocery stores (3.8%) and construction (3.7%). This industrial composition, as well as most of the other statistics, matches national statistics on minimum wage workers.
I hope this sheds a bit of light on what kinds of wirkers would get a wage increase under this proposal.
In the next installment of this series, I’ll examine how many workers would see a pay increase under this initiative. Since many workers in California currently make more than $15 but less than $18, we will see how big of an impact it could have on employers.