

Update on the jobs in the K-12 educational system
The situation is improving

March is a good time to think about year-over-year changes. A lot of things happened in March 2020, and it’s important to consider what has and hasn’t changed (has anything not changed?) since then.
As readers of this newsletter know, one of the sore spots of the recovery from the pandemic has been public sector jobs. In January 2020, the public sector counted for about 266,000 jobs in the Inland Empire, or 16.8% of the region’s nonagricultural job count. Fast forward to March 2023 (the latest month for which we have data) and it counts 257,700 jobs, which is 15.5% of the nonagricultural job count.

As the chart above reveals, both federal and state government jobs in the region have declined since January 2020. State government has shed about 10% of jobs, while federal government has essentially “broken even”. The situation with state government jobs appears to be a “new normal”, with the time series slowly but surely trending downward since January 2020, with no reversal in sight. My employer, CSUSB, as well as UCR, and all the area’s community colleges, are the major causes of this decline (non-educational state jobs are about where they were in 2020).
While the decline in state government jobs is noteworthy, it’s a minor concern given that they compose only about 15% of all public sector jobs. Many analysts have focused their concerns on local government instead, and most importantly within that, K-12 schools. Local government jobs comprise 81% of all public sector jobs in the region, and within all local government jobs, K-12 education employs 61%. In short, about half of all public sector jobs are in K-12 education.
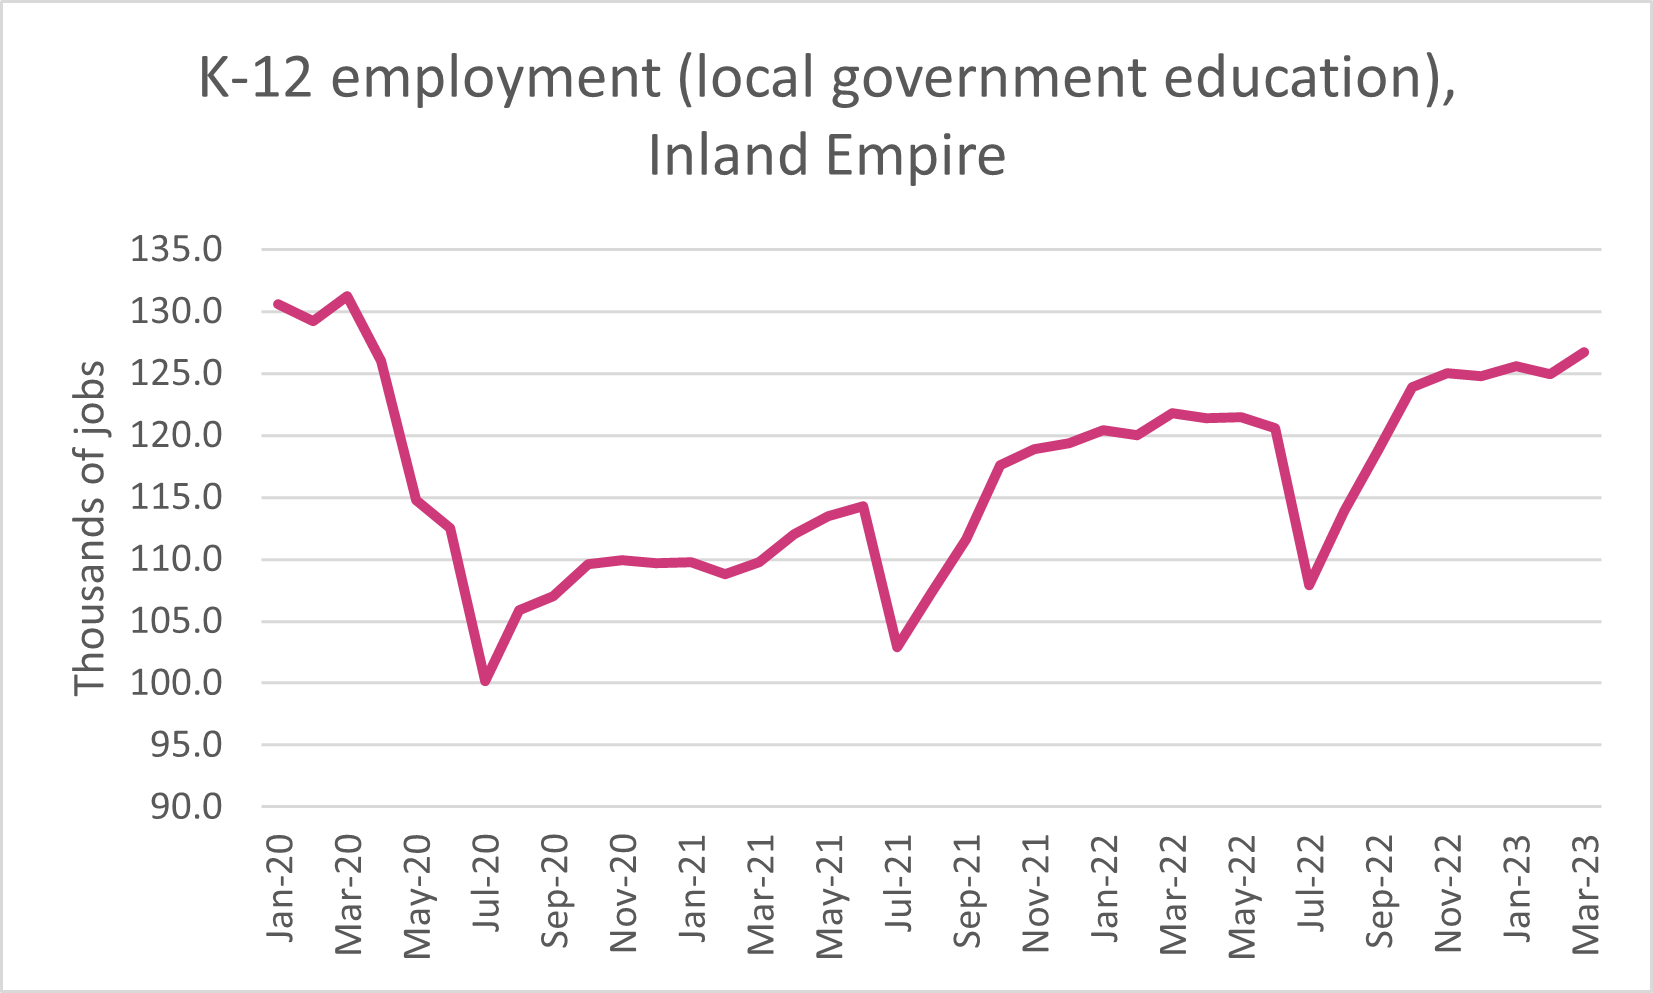
The chart above documents the big drop in jobs that happened around the pandemic. With each new school year (Fall 2020, Fall 2021, and Fall 2022), jobs have crept upward, but they are still below pre-pandemic levels.
The teacher shortage is mostly to blame. Enrollment has been declining, which can explain some lack of demand for new teachers, but the declines are relatively small; see here for a discussion of the 2022-2023 school year. In San Bernardino County in 2017-2018, 403,137 students were enrolled in all school districts. In 2019-2020, it had increased to 407,268, but by 2022-2023, enrollment had declined to 397,426 (2.4% over 3 school years, or a little less than 1% decline per year).
California has attempted some policies to solve the teacher shortage, and I believe educational institutions are doing their part to train new teachers. Hopefully jobs numbers in this crucial sector will return to normal by next school year.
Addendum: The private K-12 educational sector has also suffered losses and are not fully recovered either, but as the chart below illustrates, are slightly closer to recovery than K-12 public.
