

Resilience helps win the race
Tracking the unemployment rate over time shows a recovery similar to the Bay Area

Last week, I briefly mentioned the new household survey numbers that came out for November, for the Inland Empire. They showed a (seasonally unadjusted) unemployment rate of 5.4%. While some parts of Southern California continue to have a lower unemployment rate than this (see the map below), 5.4% is still very low. In fact, it’s the lowest it’s been since the start of the pandemic.

Furthermore, the 5.4% rate marks the progress the region has made since March/April 2020. The chart below compares the progress made in the unemployment rate in some of the major metro regions of California.
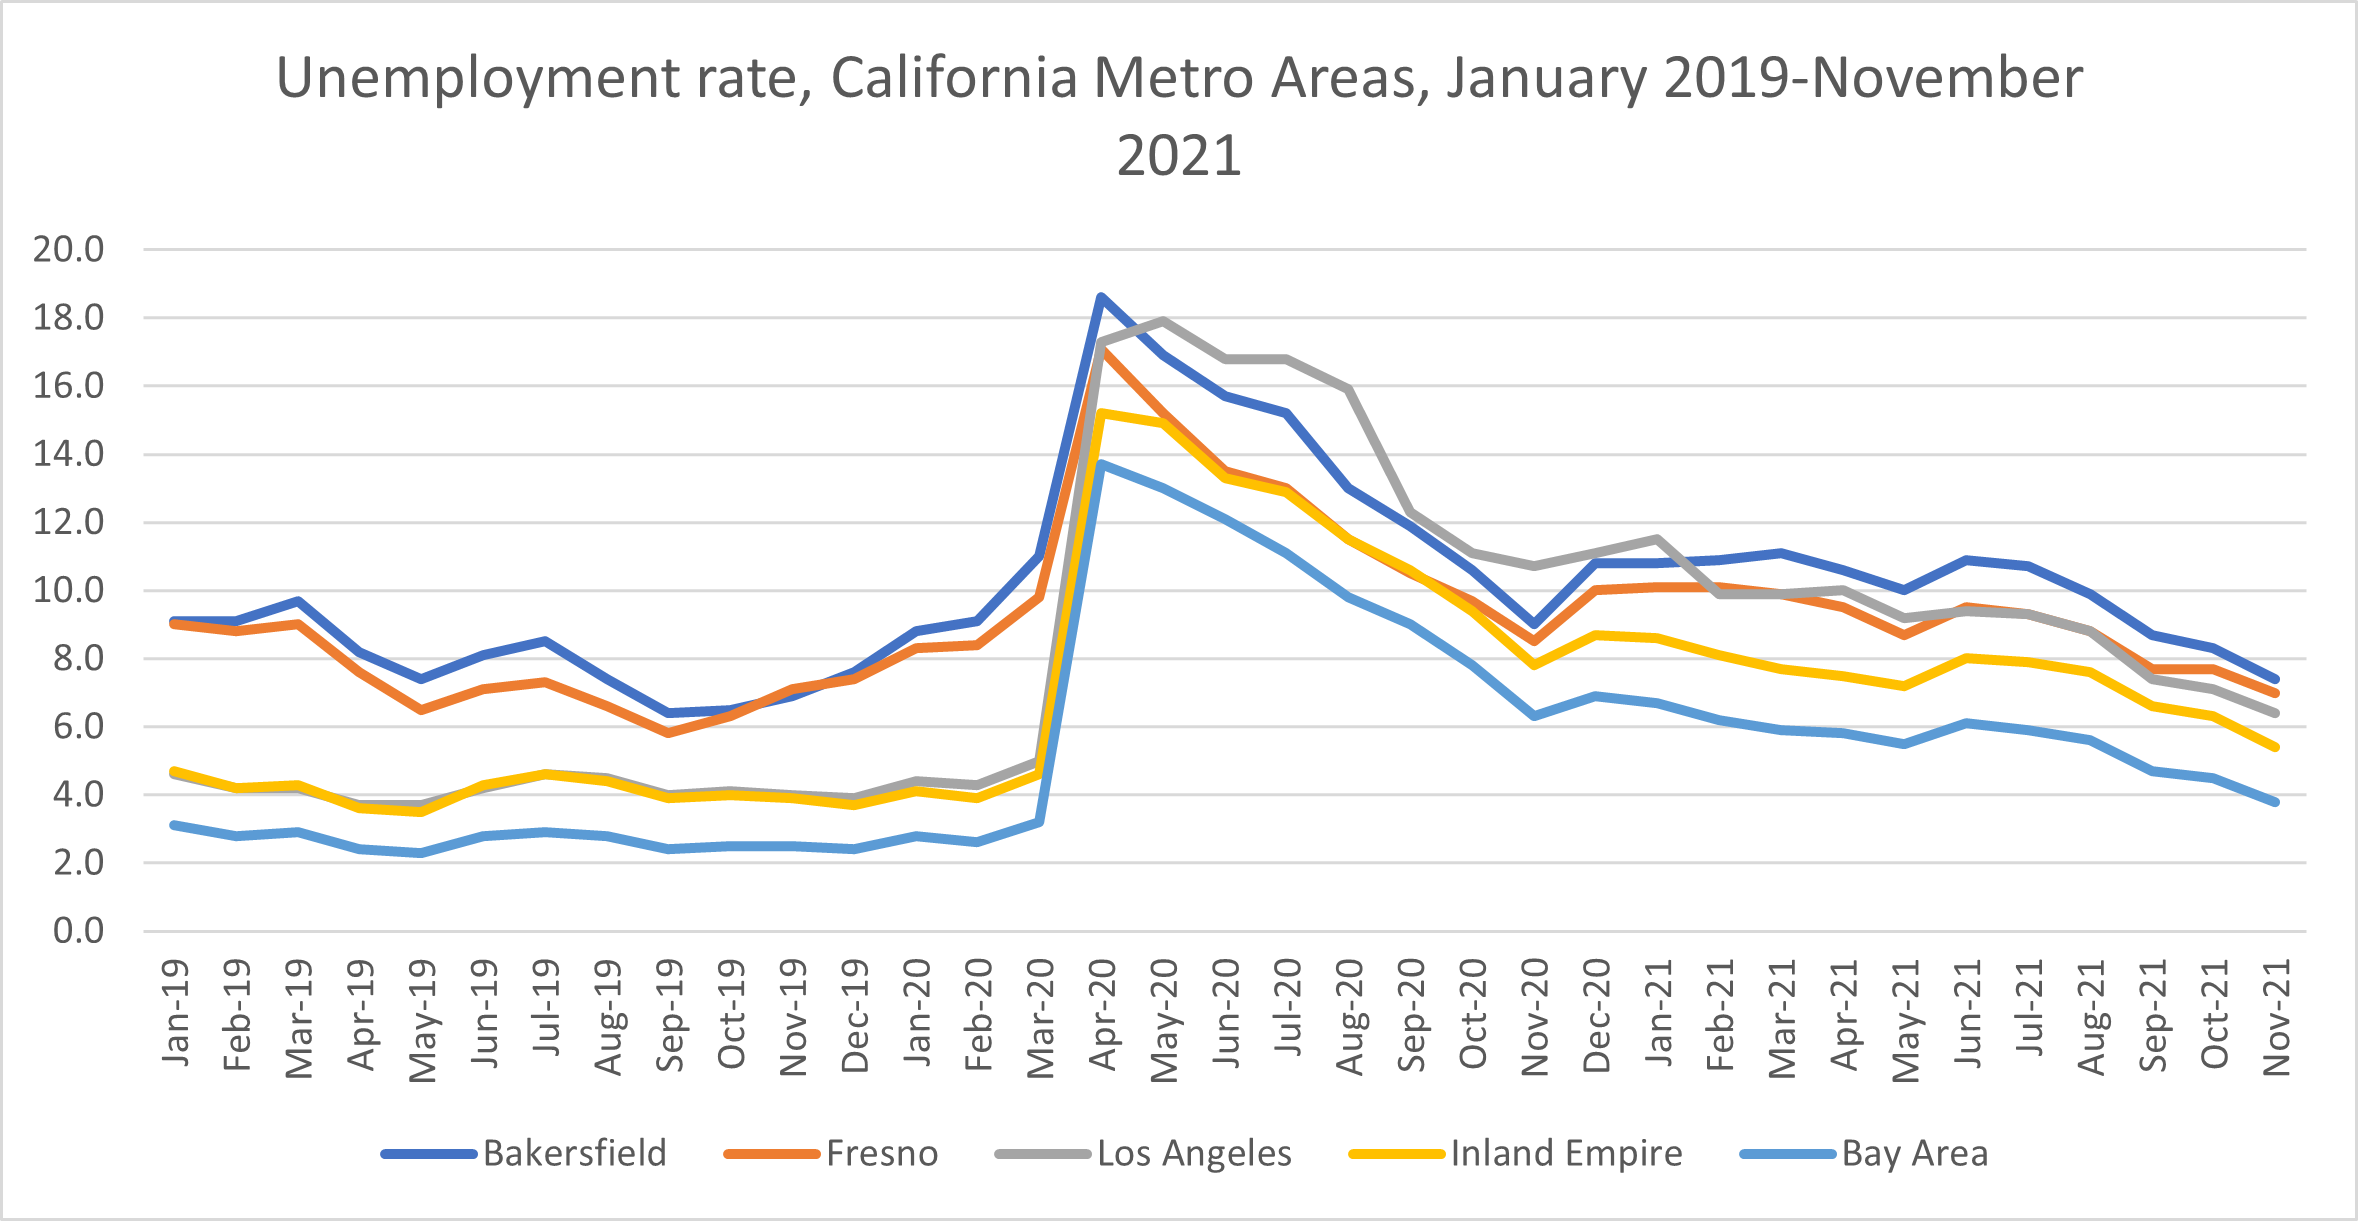
This chart shows crucial differences in the path of the unemployment rate by metro area. It shows that LA meandered at a high rate for many months after the initial spike, whereas other areas (including the IE) started falling much earlier.
A second challenging period came in late-2020, early-2021. Here, areas like Fresno and Bakersfield started to meander, while the IE again continued its stride downward, with much more substantial progress being made.
It has been the region’s ability to weather these storms so well that puts it in a good position compared to even the Bay Area, which has outperformed all other metro areas in terms of labor market recovery.