It’s not too late! If you’re still looking for a place to give for #GivingTuesday, consider joining or donating to Building Wealth Initiative - Inland Empire today. You’ll join a group of professionals who are doing a lot of good things to advance economic literacy and financial independence, especially among small businesses. Thanks for your support!
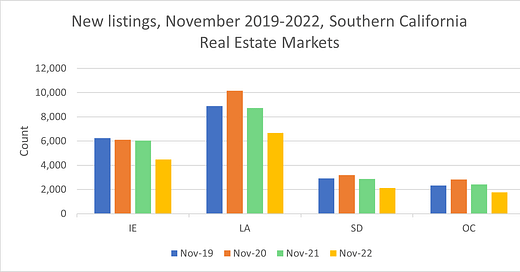
Yesterday, Realtor.com updated its metro-level real estate market statistics for November. While average listing prices in the Inland Empire increased last month, median listing prices continue to decline (suggesting a slight pickup in activity at higher price ranges). Inventory also remains high compared to the summer - median days on market increased another 4 days in November from 54 to 58. While new listings are naturally down in the winter season, year-over-year they are down a striking 26%. See the chart below, which shows that similar things are happening in LA, Orange County, and San Diego.
My indicator of adjusted expectations suggests another dramatic month for home buyers. There were 4,308 reductions in prices among active listings in November and just 190 increases. The implied ratio of reductions to increases - 22.7 - is even higher than last months previously record-breaking high of 20.1.
The real estate market continues to suffer from a “correction”, caused in part by rising interest rates, but also from a recovery from pent-up demand during the pandemic. Like many other markets, most economists and analysts do expect further declines in prices, but nothing like a “bursting of a bubble” that we saw over a decade ago during the housing crisis.


