

Inland Empire real estate market update for October
And a comparison to other areas

Happy Tuesday everyone! Let me know how you’re doing in the comments. It would be great to hear from you and hear about whatever you’re doing or working on at the moment.
Thanks to all my new subscribers. To help spread the word, I ask that you share this article with one colleague or family member who also lives in the I.E. (you can simply forward it to them).
A few highlights from today’s post (data from https://www.realtor.com/research/data/):
Real estate market in full cooldown mode: prices down, inventory up
20 price decreases for every 1 price increase among active listings in October
Los Angeles, Orange County, and San Diego are all seeing similar numbers
Until the Fed loosens its grip, interest rates are unlikely to come down
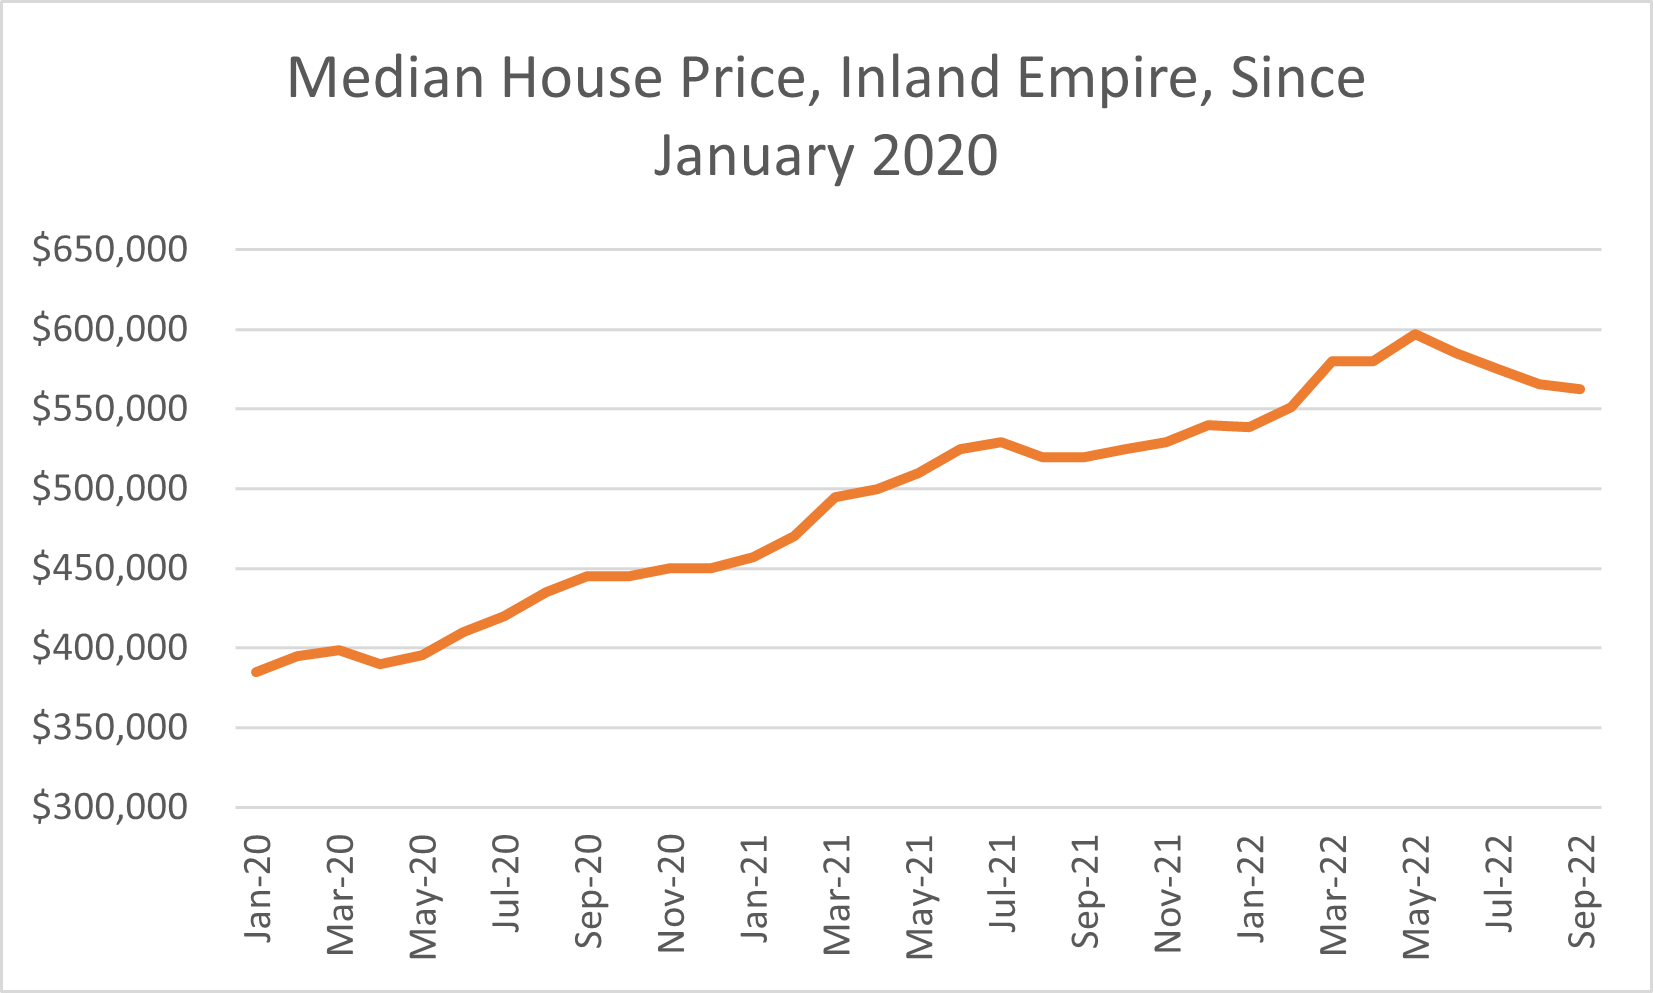
The median listing price of a home in the Inland Empire was down to $575K in October, reflecting the 4th month in a row of falling prices – down from a peak of $599K in May-June of this year (an overall decline of 4% since then). The below chart is median price data from the California Association of Realtors - only available through September.
Inventory indicators all reflect a clear upswing. Median days on market in the I.E. were at 54 in October, which is up from the May-June low of 29. More importantly, while the active listing count was at 11,334, new listings were at 5,332, which is down (also for the fourth month in a row) by 18.2% year-over-year. In other words, the increase in active listings is entirely due to houses spending much more time on the market than they did even a few months ago.
My choice indicator for market dynamics and expectations is the ratio of price declines to increases on active listings. This variable measures the extent to which sellers are having to reduce prices in order to get their homes sold, and it measures this as a comparison to the number of sellers who are able to raise prices before selling their homes. This indicator is at a high of 20.1 (!), suggesting that for every seller that can increase their home price before selling, there are 20 sellers forced to reduce their home price before selling. See the chart below.
Other areas in Southern California are experiencing the same, if not worse, conditions. According to the same Realtor.com data, Los Angeles’ new listings are down 23% year-over-year and median listing price is down cumulatively by about 5.7% over the last 4 months. In San Diego, those numbers are 16.4% and 6.2% respectively, and in Orange County they are 26.6% and 6.6% respectively. In some ways, then, the Inland Empire’s real estate market has fared somewhat better than the rest of Southern California: new listings here are down less than Orange County and L.A., while prices out here have declined the least out of these other areas.
To summarize, the real estate market continues its downturn, although many experts still forecast a relatively mild one. This is not a crash. What real estate analysts call “market fundamentals” – for example, the credit score of buyers and down payments – remain solid and do not cause an increased risk of foreclosures or a deep drop in housing demand. We will continue to experience these conditions as long as interest rates increase or remain high.
Thanks for the post! Did not get a chance to read it until today - busy and stressful week - Have a good weekend!