

Inland Empire real estate market update for September
Buckle up

Today’s post covers real estate market data for September. I am summarizing the Realtor.com data for the Inland Empire.
Several indicators are pointing to a continued cooldown in the real estate market. While median listing price is only down 1% month over month, there are substantial signs that the market has shifted more substantially. For example, median days on market are up 15 days since July to 51, a 40% increase which (percentage-wise) hasn’t happened since those dark months (April, May) of 2020. While active listings remain high, this is due to slower time to sell – new listings are actually down 1% month-to-month and 14% year-over-year.
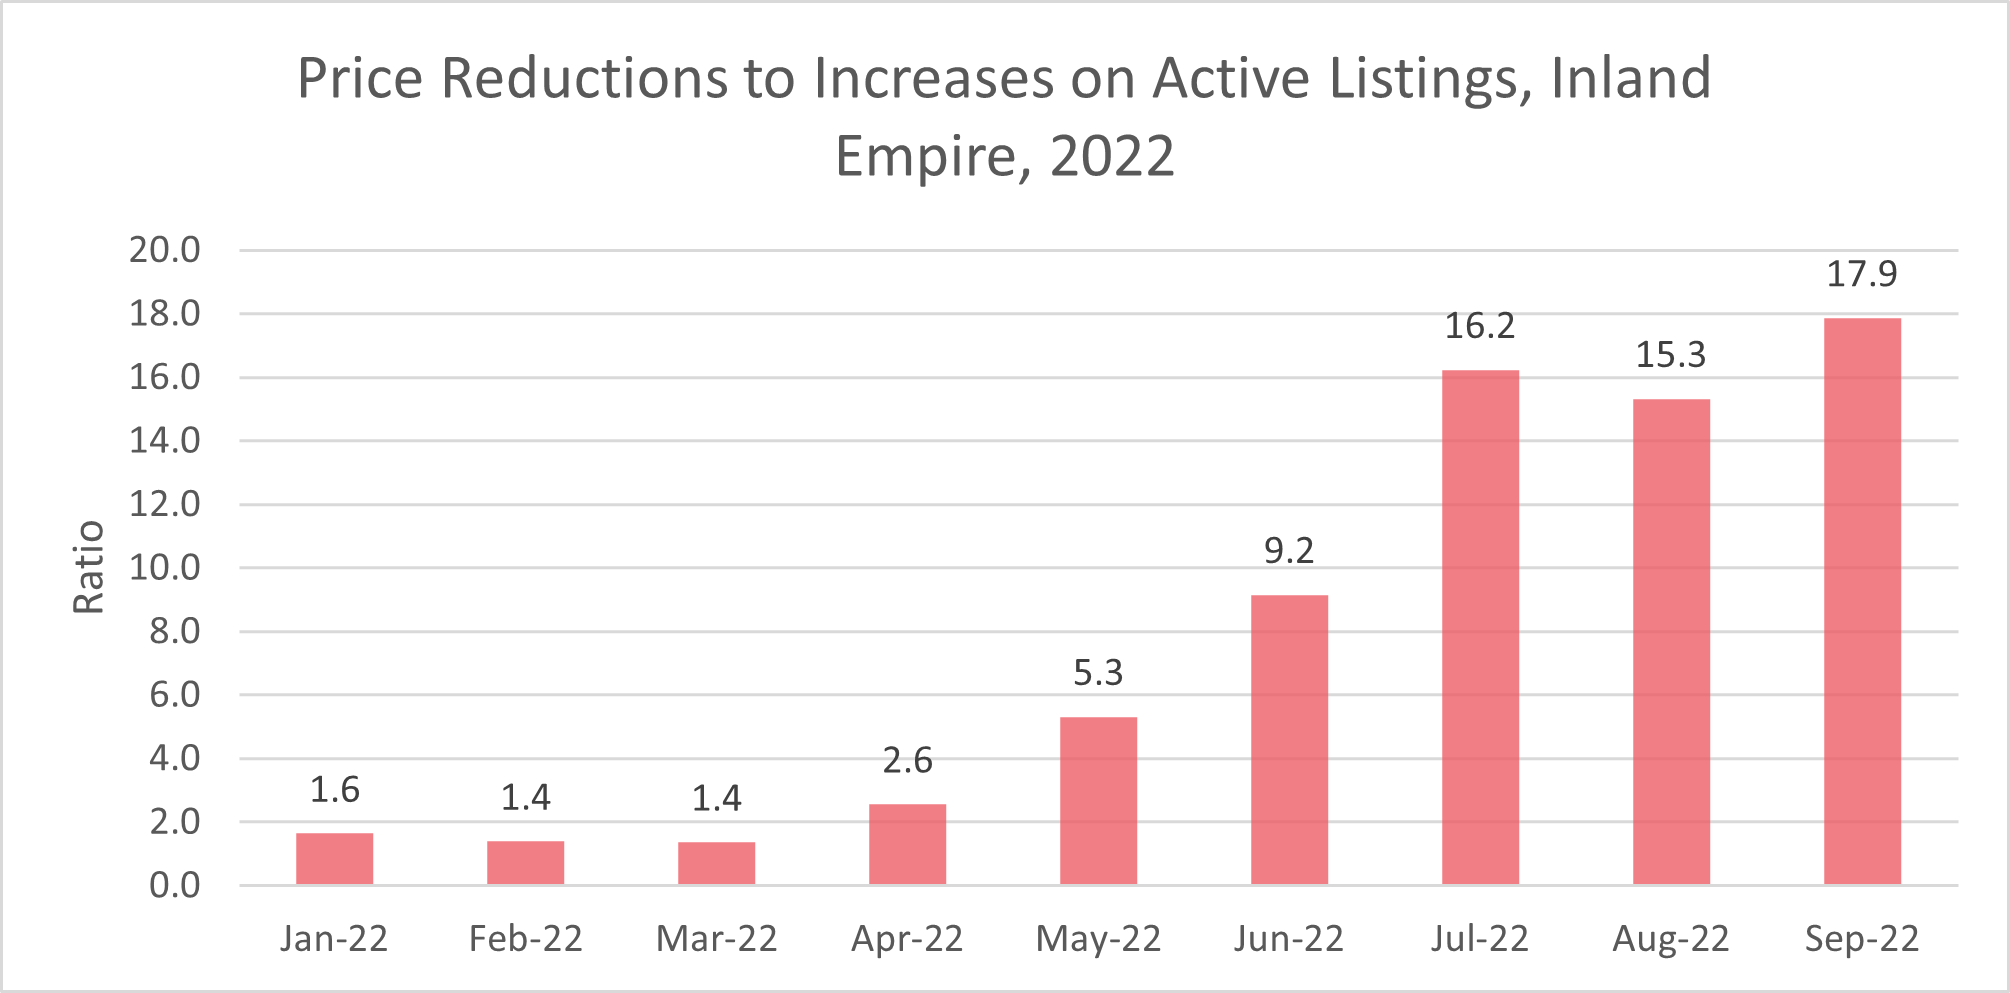
To me, the biggest sign of a turn of the tide is that sellers need to continue to revise their expectations of what they can sell their homes for. My index of expectations, the ratio of price reductions to price increases on active listings – climbed further in September, to 17.9, from just 1.4 in March 2022. See the chart below. This index has never been higher in the last 5 years of measurement. It means that for every Inland Empire homeowner that sells their home for a higher-than-listing price, 18 homeowners are having to sell their home for a lower-than-listing price.
It's likely that we’ll continue to see these kinds of numbers as we finish up the year. The average 30-year mortgage rate ended last week at 6.7%, which we haven’t seen since June 2007 (right before the housing market crashed and the ensuing Great Recession). These kinds of rates dramatically increase monthly payments for homeowners, thereby reducing housing demand.