Homeownership and housing supply in San Bernardino County
New rankings of homeownership by area, and what they mean for residents
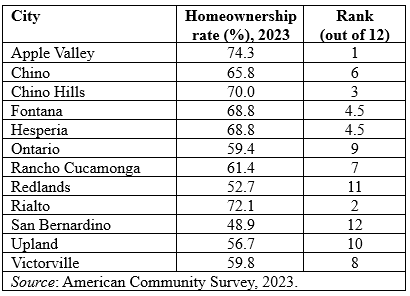
Homeownership rates in San Bernardino County increased between 2018 and 2023, from 60.5% to 62.8%. This is a good sign that cities are advancing the American dream of homeownership. But some cities are doing better than others. I ranked the 12 most-populous San Bernardino County cities on their housing statistics in 2023 – results are below.
The highest homeownership rates were in Apple Valley (1st out of 12), Rialto (2nd), and Chino Hills (3rd). Coming in toward the bottom were Upland (10th), Redlands (11th), and San Bernardino (12th). For analysis of changes in homeownership rates between 2018 and 2023, or other data requests, contact me.
The reason why Redlands and San Bernardino’s homeownership rates are so low
It is rare for Redlands to share the same place on a ladder as its neighbor, San Bernardino. But the reason is simple – something they both have in common. Neither city has built a lot of housing recently. On the other end of the spectrum – Chino, Chino Hills, and Ontario in particular – much more housing has been built. It’s not a perfect correlation, but it does exist.
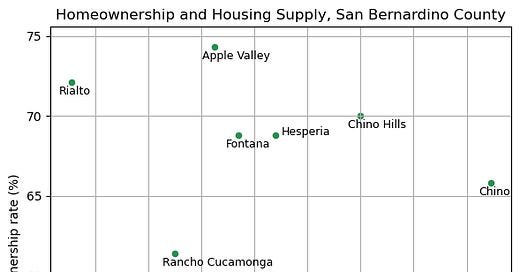
I examined the relationship between a city’s homeownership rate and the percent of its housing stock built between 2010 and 2019. The chart above shows a 0.216 correlation. The two cities in the bottom left corner are Redlands and San Bernardino – each has had low homeownership rates and low supply recently built. On the other hand, places like Apple Valley, Chino, Chino Hills, Fontana, Ontario, and Hesperia have all higher homeownership rates and almost double the % of housing units recently built.
Communities that build more have higher homeownership. Those cities in the bottom left corner should do more to encourage building homes and increase access to ownership for their residents. If space is an issue, higher-density projects like what other cities on this chart are doing, such as Ontario, are an effective strategy.
Other variables in my San Bernardino Housing Statistics Report (2018-2023) include overcrowding, total housing units, owner and rental costs, and median home value. I provide snapshots and analysis of trends over time. I also have a similar report for Riverside County. Contact me for more information about any of these products.


