Current data show improvement after summer slump
This week I am checking back in with a few indicators that worried me over the summer. Today: current economic indicators; Friday: the real estate market. The consumer spending data reported on in this article come from Affinity Solutions (published by Opportunity Insight’s Economic Tracker), and the unemployment insurance claims data come from California’s Employment Development Department.
It’s not news that summer economic performance was well below expectations, manifesting itself in everything from weakening local labor markets to dialed-down forecasts of national economic growth. Locally, we could see this almost real-time in the declines in consumer spending. However, these metrics have reversed course through August, putting the Inland Empire in a much better position than it was in June and July.
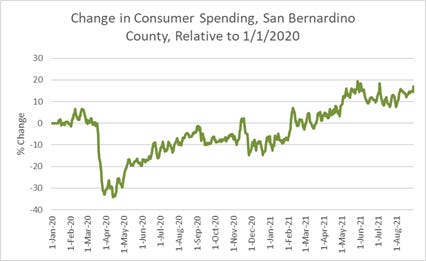
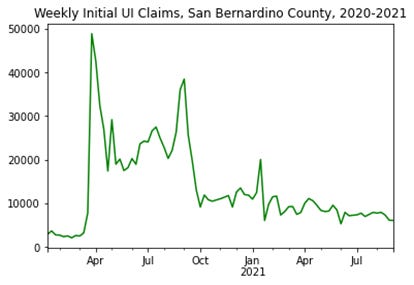
In San Bernardino County, consumer spending is up about 15% compared to January 2020, and the decline in this indicator that we saw throughout June and July has turned into a moderate increase in August. Look carefully at the last few months of the above graph to see the change: declines starting Jun-21 through Aug-21 have started to reverse over the last month. Initial unemployment insurance claim 4-week-averages are also showing promising signs, trending downward again in San Bernardino County, as seen below.
If you look carefully, you’ll see an upturn in June/July of 2021, but in the most recent weeks, the line has come back down.
Labor supply shortages continue to be an issue, but at least on some metrics, the economy is looking better going into Q4 of 2021 than it will in Q3.


