August real estate update
Update since last Tuesday: This is a slow week for economic data and news. In the local papers, Kevin Smith presents uplifting news for brick-and-mortar retail. As usual, Jonathan Lansner writes an excellent analysis of the rental market, suggesting a turnaround might be on the way. KVCR had a segment on student debt relief for Black Voice News; highly recommended.
Thank you to all my new subscribers. If you’re looking for a specific data visualization product or piece of data, or if you’re just curious about a statistic, feel free to reach out to me via email or through a comment on the newsletter. I’m always happy to help. My subscriber base continues to grow and I thank you all for the support with sharing articles and links.
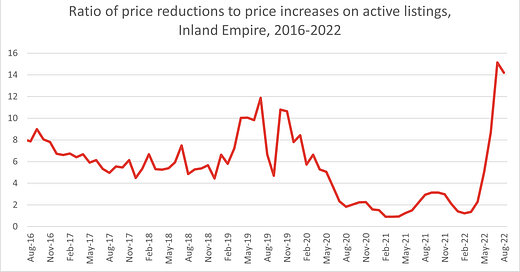
I am using two major data sources to track the region’s real estate market: California Association of Realtors (“CAR”) for inventory, prices, and days on market, and Realtor.com for listings, prices, and days on market. I also use Realtor.com data to develop my own index of market dynamics, which is the ratio of price decreases to price increases on active listings. I am using this index to evaluate the discrepancy in market expectations between sellers and buyers. Last month the index increased sharply, suggesting a rapid change in market uncertainty.
Unfortunately, CAR data for August are still not out yet, so I’m presenting Realtor.com data today only.
Prices and price dynamics
Drawing on the Realtor.com data for the Inland Empire, I find that median price declined in August to $587,000, from $598,000 in July. This is still an 8.2% increase year-over year, but it represents the third straight month of declining prices.
The ratio of price reductions to increases on active listings remains at a 6-year high. This statistic was 14.2 in August after being at 15.1 in July and 8.7 in June. The index had been hovering around 2.0-3.0 since July of 2020 and has never been this high in the last 6 years. See the chart below.
Time on market and other inventory indicators
Inventory indicators also suggest a slowdown. I find that median days on market in the I.E. were 42 in August, up from the mid-20s this summer and up from 31 days a year ago. Total listing count was 16,463 in August, which is up 10% from a year ago, but the increase is due to houses taking longer to sell – new listings in August were 5,532, which is down 9.1% from last month and down 16% from a year ago. Thus, the increase in total listings doesn’t reflect new homes on market, but rather existing homes taking longer to sell. The statistics suggest there is considerable hesitancy about placing one’s home on the market at this time.
See the chart below on median days on market. while time on market naturally begins to rise as we move out of the summer season, the increase we’re seeing now is much faster than normal.
Summary
The Inland Empire’s real estate market is now clearly heading downward; at this point, the question is how much of a drop in prices and how much inventory will increase.


